
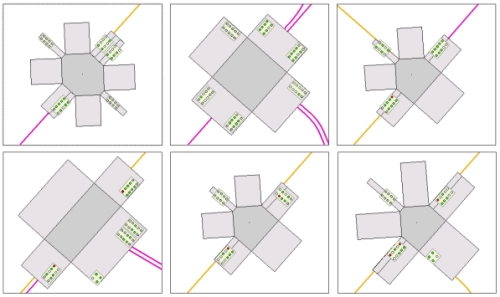
Recently, we were challenged to create a graphical report that displayed the area around each junction in an ArcFM™ Conduit Manager™ trace. The specific business requirements that initiated the development of this tool were to show individual manhole butterfly diagrams in the order that they fell along a selected circuit.
This report is required to hold any number of map frames per page, and show the pertinent information in each frame. Typically, these types of reports can be many pages long, so an efficient means of ‘turning the page’ was required. The tool would need to be able to generate the maps and then export the report to a PDF file or print it with user-defined settings.
We get excited when a client presents a new challenge for us. It is an opportunity to take on a new problem and find an innovative approach to giving our clients what they need. Given specific requirements like those summarized above, our goal is to create flexible, configurable tools that can be applied to an unlimited number of scenarios.
The Solution:
The Graphical Report tool handles a list of features returned by a trace or any type of aggregate method as an input. In this case, the tool uses a trace of a conduit’s path through manholes. Once the user has run the trace, the custom tool is enabled for use.
The tool does not require a specific template. Instead, when run, it will copy the primary map in the ArcMap view and distribute the copied maps to each available map frame of the configured page layout. Each new map frame is zoomed to the appropriate extent over each manhole. The manholes are ordered in the frames based on their position in the trace path.
The Innovation:
We’ve talked about how one page of the report is generated and how that looks, but the real usefulness of the tool is the custom paging. Unfortunately, ArcMap (as of version 10.1) does not yet provide functionality to employ multiple pages using the page layout interface.
Because of this, we decided to implement paging ourselves. A Graphical User Interface is provided with the tool and is the control center for the custom report.
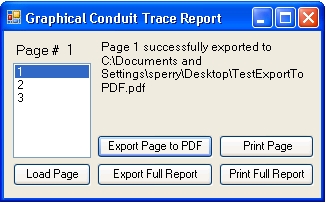
In this example, the trace returned 19 manholes, and the page layout and configuration was set up for six manholes to be printed per page. For this report, there are four pages of map frames, each containing a butterfly diagram. The control center allows the user to load any page they wish, instead of only being able to go to the next page.
Additionally, the Load Page button uses the current map layers, and loads them into each of the map frames. This significantly reduces the load time per page.
The Output:
The Graphical Report tool provides four buttons that give the user flexibility in generating a report. Here is a quick breakdown of each one:
- Export Page to PDF: Saves the currently displayed page as a PDF with a name and location specified by the user.
- Export Full Report: Saves the full report as a single multi-paged PDF.
- Print Page: Opens ArcMap’s Page Setup dialog and then prints the currently displayed page using the specified printer settings.
- Print Full Report: Opens ArcMap’s Page Setup dialog and then prints all of the pages of the report using the specified print settings.
Whether you need a digital or hard copy of the full report or just a page, the options are provided.
The Graphical Report tool can be used with any page template that has map frames and can be generated with any feature set. This versatility gives users a wide range of unique reports that can be created. Additionally, the tool is easy to use by providing a simple user interface to control the report. By enhancing the reporting features provided in ArcMap, primarily through pagination, this tool allows functionality that isn’t currently offered.
We believe innovation is the key to success, and this opportunity is another step in that journey.

What do you think?