
While Python is commonly used in GIS to develop tools and automate processes, it can also be incredibly useful in another aspect of data handling: raw data processing. Data in the form of spreadsheets or other text files can be cleaned up, sorted, modified, and combined into a single source to streamline data projects. Source processing for data projects can take weeks or months if performed manually; using Python has clear cost savings in both time and hours spent.
For brief background, I am a relative beginner in Python scripting. However, within the course of a month, I was able to learn enough to write a functioning tool that can sort through dozens of spreadsheets, find each line of data that matches a specified format, and combine it all into a single spreadsheet that can be imported into a database or, with coordinate information, directly into a feature class or shapefile in GIS. This tool takes only minutes to run, as opposed to hours and hours of manual effort.
The tool searches through a specified folder or directory and looks for any file that is a spreadsheet. When it finds a spreadsheet, it opens the file and looks at the names of each sheet. Specific sheet names can be skipped; for example, if a sheet title involves the word “Miscellaneous” or “All” it can be skipped as it contains unrelated or duplicate information.
When a worksheet is found that may contain project information, the tool reads every column heading and looks for any headings that are in a specified list; this list contains headings to record the data from, as well as headings to change. For example, the tool can change “Xfmrs” to “Transformers” to keep headings uniform across spreadsheets.
[expander_maker id=”2″ more=”Read more” less=”Read less”]

For every worksheet it opens, the tool evaluates each row that contains project-relevant data. It determines this by looking at a specific column that is critical to the project; if this cell is null, the row cannot contain useful project data. The tool then looks for the intersection of each row with a specified heading, then copies that value into a specific point in a list. For example, “Zip code” always gets copied to the 6th slot in a list. This list is then pasted into a separate “list of lists”.
The reason to copy each list of data into a separate, overarching list is to avoid having to open and close each spreadsheet for each line of data, resulting in a severe hit to system performance. In this way, the spreadsheet can be opened and closed only once, and then the file containing all data can be opened, have the list of lists pasted into it, and closed.
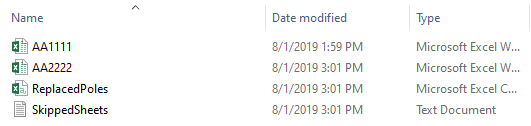
User feedback can be customized to any level with Python. I have the tool set up to display what spreadsheet is currently being worked. It also generates a text file at the end of processing that tells me which files or sheets were skipped, in case any need manual review.

The finished result of this tool is a spreadsheet that can be used to set up a tracking database for workers, have further analysis performed, or be imported directly into GIS as a new layer or feature class. For the project I ran this tool on, it returned over 36,000 rows of information with very little review needed, all within about 10 minutes.

While this tool is written for a specific project and data set, it can easily be re-worked for another project or generalized to work with any project, saving time from having to rewrite a similar tool for another project.
Python has a wide range of applications for data projects beyond GIS analysis and automation. It can provide time savings and accuracy to any project that needs data review or consolidation, and is a worthwhile addition to any project or anyone’s toolbox of skills.[/expander_maker]

What do you think?