Objective
The purpose of this White Paper is to illustrate the make up and functionality of a sample Utility Network (UN) model of a Pad-Mounted Single-Phase Transformer. The model is implemented as an ArcGIS Pro template and uses component from the Electric Distribution Asset Package (EDAP) v2.0.1.
Introduction
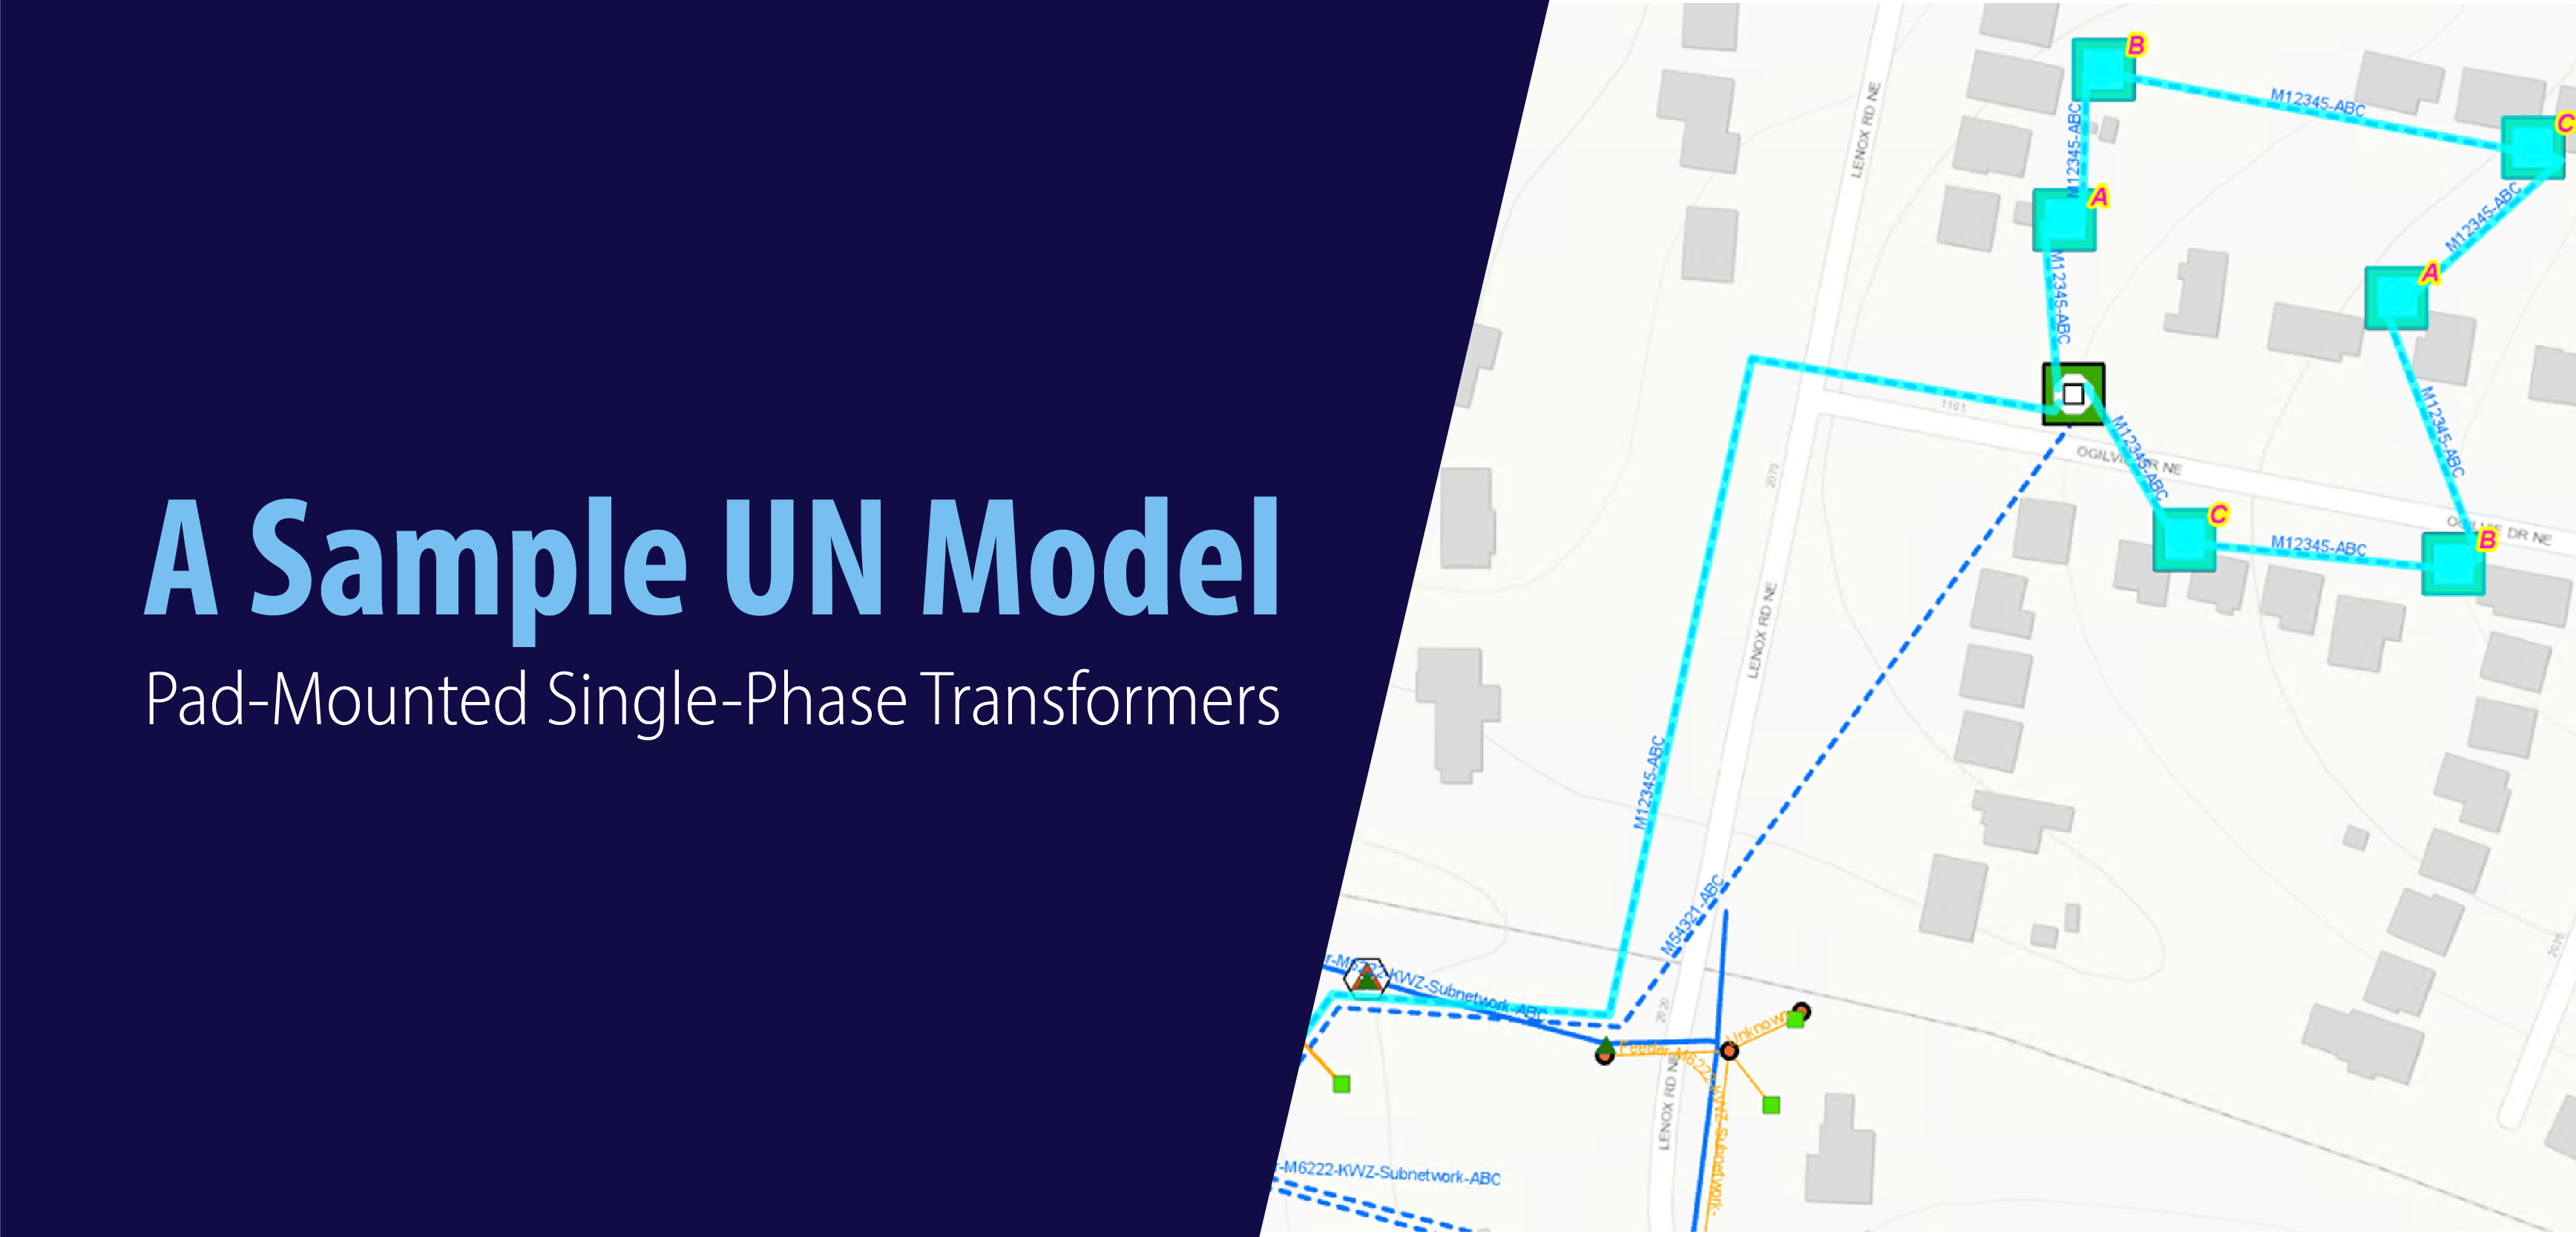
A common circuit layout to provide electric power to residential subdivisions is referred to as an Open Loop Feed. These open loops consist, among other equipment, of three-phase underground distribution lines, and pad-mounted single-phase transformers servicing the customers. The transformers are connected in series, each drawing power from a given phase so that collectively the open loop is phase-balanced. For example, if six single-phase transformers are used for the open loop, they may be distributed in an alternating sequence of phases: A, followed by B, then C, back to A, etc… An example of an open loop feed is shown in Figure 1.

NOTE: In this example the open loop feed starts and finishes at a pad-mounted switchgear; lower left.
There are two important considerations to keep in mind when modeling these types of circuits:
- Modeling the behavior.
- Modeling the assets.
Using the UN model, this white paper presents a Pad-Mounted Single-Phase Transformer Installation that implements the functional behavior of an open loop feed, while attempting to account closely to the assets being laid out in the field. A detailed explanation of this model follows.
Installation Template
An ArcGIS Pro reference template has been designed using the UN model to implement the installation of Open Loop Feed Pad-Mounted Single-Phase Transformers. Figure 2 shows an instance of the template used for B-Phase installation.
")
The template consists of:
- A Structure Junction {Pad, Pad}; green square in the middle.
- An Assembly {Transformer Bank, Pad Mounted Single Phase}; on top of the Pad.
- An Device {Transformer, Pad Mounted Single Phase::B-Phase}; above the Transformer Bank.
- Two Devices {Fuse, Underground Single Phase Load Break Elbow::B-Phase}; at each side of the Transformer. By default, the template elbows are configured as closed.
- A Junction {Line End, Low voltage Single Phase Terminator::B-Phase}; above the Transformer.
- A Junction {Connection Point, Splice::ABC-Phase}; at lower extrema of template.
- A Line {Medium Voltage, Underground Two Phase::AC-Phase}; connecting the Splices.
- Two Lines {Medium Voltage, Underground Single Phase::B-Phase}; connecting one Splice with its closest Underground Single Phase Load Break Elbow.
Analogous installations were implemented for A-Phase and C-Phase.
The installation template also imposes the following UN Association Rules,
- The XFR:High terminal of the Transformer is connected to the Elbows.
- The XFR:Low terminal of the Transformer is connected to the Terminator.
- The lines are snapped to the Devices or Junctions; hence connected.
- All the elements, except the Pad, are contained in the Transformer Bank.
- And the Transformer Bank is attached to the Pad.
NOTE: The choice of elements was limited to what EDAP provides OOTB; allowing for a quick prototype. For a client application, other elements (and their corresponding rules) may need to be added to the model.
Installation Placement
Each installation is placed along the open feed loop by splitting the 3-Phase underground line. Figure 3 shows a B-Phase installation splitting the loop feed 3-Phase backbone line.

Testing Behavior
The proposed installation model supports the following functional behavior.
Because the transformers are connected in series by phase, failure at an upstream transformer results in the de-energization of any other downstream transformer on that same phase; but without affecting power delivery on the other phases.
In the examples below, we illustrate the results of tracing on all phases, as well as tracing on B-Phase through the open loop feed. For the second scenario, we compare the results of the B-Phase trace when all installations are functioning correctly (normal condition) versus the case in which the upstream elbow of an installation is faulty (abnormal condition represented by an elbow status of “open”). The example shows the open loop feed being fed by two subnetwork controllers: M12345 (the left breaker) and M54321 (the right breaker.) A pad-mounted switchgear is configured to feed the open loop via M12345, while keeping the circuit isolated from the M54321 alternative feed by an open switch (see Figure 4).

Example: Trace All Phases
Figure 5 shows the result of tracing downstream from the DT:Load terminal of the Circuit Breaker at the head of the distribution feeder.

The result shows that the open feed loop is energized by the M12345 breaker; while the switchgear maintains both subnetworks isolated from each other.
Example: Trace B Phase – Normal Condition
Considering normal conditions in which the equipment is operating correctly, a trace on B-Phase shows that the full extent of the B-Phase in the open loop feed is energized, as depicted in Figure 6.

NOTE: A trace on B-Phase does not return equipment, assemblies and structures that do not participate in the propagation of the B-Phase, as expected. The figure shows how A and C “sections” of the open loop are not returned by the trace.
Two important details of the template installation, as regards selected-phase tracing, are worth analyzing.
First, Figure 7 shows a close-up of the results of the B-Phase trace through a B-Phase installation.

The trace, which in effect represents the flow of current, travels through the B-Phase components of the installation.
Second, a closer look at the trace through an A-Phase installation, Figure 8, shows that the installation is “by-passed” through the 2-Phase line, in agreement with the fact that B-Phase current does not flow through the A-Phase equipment.

Example: Trace B Phase – Abnormal Condition
What if the upstream elbow of a B-Phase installation blows out? The B-Phase current is deenergized downstream from the elbow, as shown in Figure 9.

A close-up look at the results of the B-Phase trace around the elbow under abnormal conditions, Figure 10, shows that the trace stops at the elbow, as expected.

Up to this point, the previous examples demonstrate that the proposed installation models the expected behavior of the equipment. Now then… What about asset representation?
Testing Asset Placement
When constructing an open loop feed on the field often times whole sections of the 3-Phase feed are laid “by the spool”. If at some point down the length of this 3-Phase line a single-phase transformer is to be installed, say B-Phase, then only the B-phase wire is spliced to provide connection to the pad-mounted equipment; while the other two wires remain uninterrupted.
Therefore, from an assets point of view, once the wire bringing power to the installation is split it represents two different assets; while the assets corresponding to the other wires remain whole.
The installation template proposed in this paper violates asset preservation because it “splits” all the wires at every installation; regardless the phase of the installation.
An alternative model of a template that preserves asset information has been proposed by Tom Brown, of Esri, and it is depicted below in Figure 11.

By comparison, this model is very similar to the installation proposed in this paper. However, this model not only provides the same functional behavior as the proposed model, but also preserves asset information.
Asset preservation, though, comes at the cost of modeling electric lines as single-phase objects – one line per phase; and possibly one more line object to account for neutral. In other words, this single-phase wire model would require one, two or three times more lines than the proposed “splitting” multi-phase line model.
The UN is fully capable of representing distribution lines at the asset level: one line per phase. Yet, the added complexity, particularly when mapping these lines in highly dense areas (as downtown meshed networks) may need to be taken into consideration when adopting one model or the other.
As always, it is the business case what drives how the technology must implement a particular solution.
Conclusion
The current white paper presents an ArcGIS Pro template based on the UN Model that implements a Pad-Mounted Single-Phase Transformers installation. This model finds usability when representing service transformer connected in series down an Open Loop Feed.
The strength of the template installation resides in its capability to model the phase-by-phase behavior of such a common distribution layout. However, the proposed installation, as is, does not preserve asset information.
The model is compared to an asset preserving model based on single line-per-phase representation. The merits of both models are briefly discussed.
Variations on either model (or both) may derive from the need to satisfy specific business requirements. The resulting variation would then be adopted by interested parties.

What do you think?