Last month, in the Filtering Your Data article, we mentioned the interactive attribute table feature from the December 2012 ArcGIS Online enhancements release. Our blog community wanted more information on that enhancement, so we thought we would spend a bit more time on it.
Displaying the interactive table in ArcGIS Online can be very useful for analyzing the data in the layer. You can perform several operations on the table including: sorting, resizing, reordering, hiding, and selecting and zooming to specific data points on the map. This turns your map into a more interactive dataset – similar to working with a spreadsheet. You can also use it to just spot-check the data in a map that was published by a user.
Showing the table is pretty easy. Just click the arrow to the right of your feature layer in the details panel. You will see the “Show Table” option – just click it!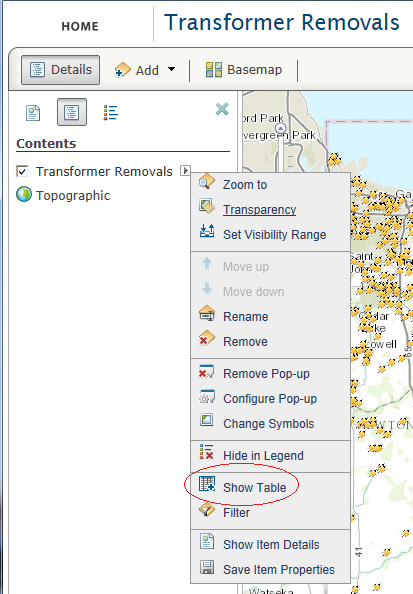
The table appears on the bottom pane under the map.
We will now run through the operations you can perform on the table:
- Sorting a column – click the header of the column you want to sort and a pop-up will appear
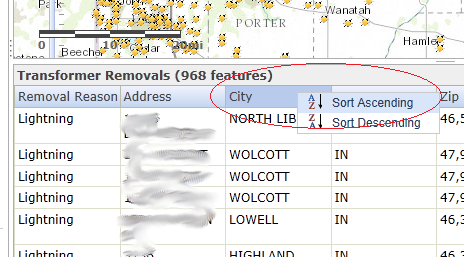
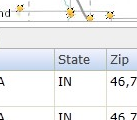
After selecting Ascending, the data is sorted instantly. - Resizing a column – simply hover the cursor near the edge of the column and when it changes to the resize cursor, drag it to your desired column size.
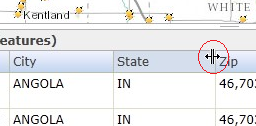
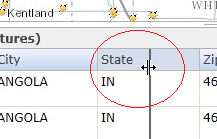
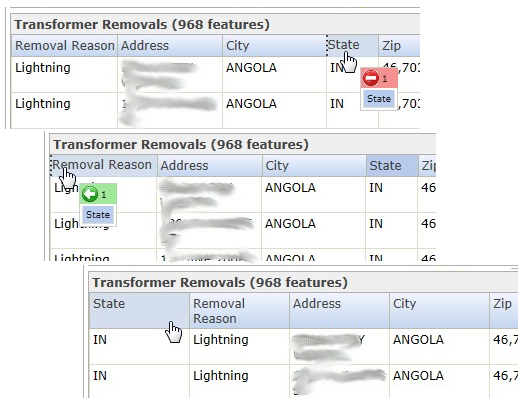
- Reorder the columns – left-click and hold the column header and move/drag it left or right.
- Hiding a column – click on the “Table Options” menu and choose “Show/Hide Columns“.
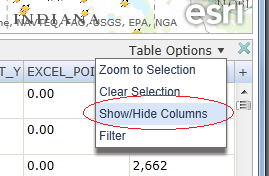
You will notice that the check/uncheck of a column performs the operation in real-time – there is no save/apply button to press!
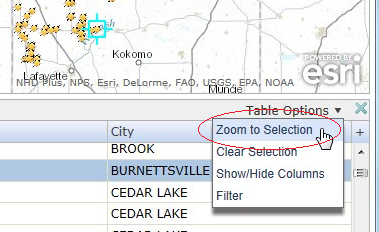
- Select and Zoom – by selecting one or more (by holding down the Shift key) rows of data, the map will show your selection. Then, through the “Table Options” menu, you can choose “Zoom to Selection” and the map will zoom (as far as it can, depending on level of zoom available) to the location. To clear the selection(s), choose the “Clear Selection” menu item.
Now you may have already noticed that there is a “Filter” option under the “Table Options” menu.That is where you can quickly jump into the new filtering enhancement that we wrote about last month. If you haven’t already read that article, you can find it here. Real quickly, we can change the transformer removal reason to “Storm” and see the new filtered results in the table.
That’s a quick overview on the new interactive attribute table that was first introduced in the December 2012 ArcGIS Online updates. If you would like to see what else is available, please visit the What’s New? page from Esri.


What do you think?