
Is the UTILITY Pipeline Data Model (UPDM) only for utilities?? We are here to tell you that it is not, and the benefits of the model and network management is an ideal fit for your midstream and/or upstream operations (even without any distribution assets!).
Over the past year working with vertically integrated gas clients, and their implementations of UPDM, our team has seen the benefits that the data model, Utility Network (UN), network management and out the box tools could bring to the pipeline/upstream space. A recent client put it best, “Isn’t our gathering system just a distribution network flipped upstream?”….and it absolutely is. So why don’t we manage it that way? Electric GIS systems have been managing their assets from generation to the consumer (through transmission) in a network for years, but oil/gas/specialty gases haven’t because we have been unable to linearly reference transmission pipelines in the geometric network.
Pipeline GIS management has been working in a linearly referenced world that does not take into account our system as a whole. We manage and look at our data from the route level. This includes managing our online events, pipeline attribution, pressure data, documentation, MAOP/MOP analysis, HCA and Risk. Instead of managing singular routes, or combination of routes (line/system) to build our asset representation, we need to look holistically at the entire operating footprint. This is where UPDM can support our needs.
In my opinion, everyone in the pipeline space is getting hung up on the “U”, no not that “U”….

….but the “U” in the naming of the Utility Pipeline Data Model. Pure midstream or upstream operators don’t even look at this model, since at the surface, it seems to be only for utilities.
For all the GIS Managers, Engineers, Data Analyst and individuals managing the safety and operation of your entire pipeline system, lets take a blind database taste test:

Database/Schema A
|
Database/Schema B
|
So which model would you chose?? If I’m running SSP Midstream Co and wanting to manage my pipeline/gathering GIS system, I’m going with database schema B. If we pull the cards up, we see that Database A is PODS and Database B is UPDM. So…lets drop the “U” and just look at the pipeline data model, network management and tools that best fits our needs.
There are several differences that we can focus on, but for today’s post we will look at some of the key visualization tools, containments and tracing. A previous post introducing Utility Network Management for Gas helps explain sub-networks and tier groups if you are interested in those concepts.
The new UPDM model and Utility Network Management extension has a number of editing tools, analytics and visualization tools that come out of the box. Users can:
- View thematic cartographic maps for different use cases, such as customer/product service, field collection and inspection, or network management.
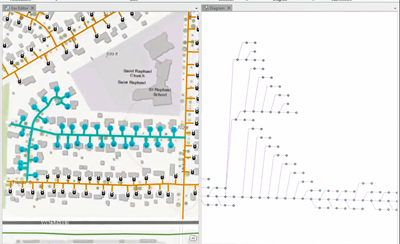
- Create network diagrams that allow you to readily check network connectivity and create logical views of your network in a more simplified, symbolic representation of the information.
- Visualize a selected pressure zone or CP system with a display filter.
For analytics, it starts with how the model is structured and designed for high performance. Increasingly our GIS database is growing and growing. The service-oriented architecture of the Utility Network was designed to accommodate the data, network topology and scalability. The core data model is engineered for maximum efficiency by limiting the number of feature classes and reducing slow relationship queries. The classification system uses attribute domains and subtypes and is built-in for each of the utility network feature classes. This allows the utility network extension and tools to rapidly traverse network features that are connected or attached to structural features.
Using this architecture and network management, users can model analyze and report from the well head, into gathering lines, through transmission and down to the consumer or output. Network analysis is based on the core asset network or through the collection of subnetworks.
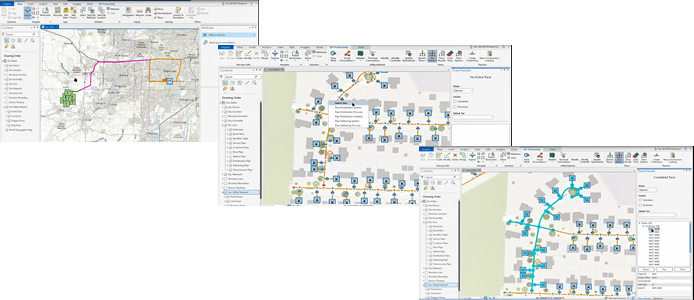
A utility network uses the sources of the resource to define the start points of a subnetwork and traces down to the ends (or sinks) of a subnetwork to discover its entire extent. When a valve is changed, the extent of a subnetwork is recalculated. Categories are also defined on devices to enable more advanced tracing analysis, such as setting which devices are protective in case of a condition such as excessive pressure that can potentially threaten the subnetwork.
The last key differentiator we will discuss today are containments. Containment in utility network is a way to model assemblies or stations in your network while maintaining map clutter. As we see in the diagrams below, we have a containment represented as a single icon/symbol when we are zoomed out, but as we zoom in, we can see all the assets as they are represented in the operational network.
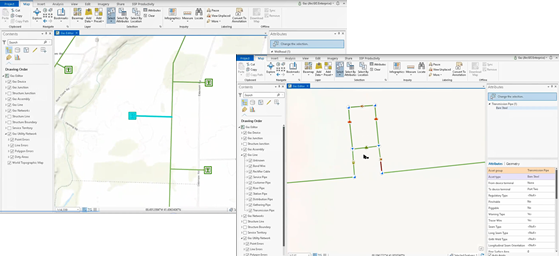
The containment feature is intended to be created to represent the full collection of internal features. This sounds awfully familiar to years of requests or questions around managing stations, running analytics through stations (MAOP/MOP) and a better representation of our system versus traditional models.
When you perform a subnetwork trace, the status and layout of the content features inside a container feature are honored. If an internal valve is open or closed, the subnetwork trace will honor that valve status. Container features can also be connected to other container features.
Containments alone will provide our operational view to greatly expand. Product doesn’t stop at the fence line, so why should the model and GIS representation?
So are you ready to drop the “U” in UPDM and gain the benefits of a pipeline data model with true network management?
Need more? Make sure to come meet the SSP team at the Esri UC to understand how your data can fit in UPDM. If you can’t make it to the conference this year, reach out to our experienced team to schedule a chat [email protected]

What do you think?