What is a feature report/why do I want one?
Here at SSP, we are in the business of GIS for utilities. A lot of times we’re asked about generating standardized reports from data in a client’s GIS. We call these reports “feature reports”. A feature report is a PDF that contains information about a specific feature in the GIS. These PDFs could be printed, stored as an attachment on the feature in the GIS, or stored in an asset/work management system. A report can be as simple as printing a few attributes about a feature, or it could have attributes, a map view, charts/graphs, the sky’s the limit! What I’ll share in this post is the process I went thru to create a relatively simple feature report about some of the SSP offices. The report will contain a header image (the SSP logo) some attribution (office name, phone number, address, coordinates, etc.) a map view that contains an aerial image of the office, and a simple chart that contains high/low-temperature data for the office over a few days.
What’s Needed?
If you’ve got ArcGIS Pro on your computer, most of the python libraries needed for making these reports are already on your computer! The only library that doesn’t ship with ArcGIS Pro that we’ll use is pdfkit, which is used to convert an HTML file to a PDF. Beyond ArcGIS Pro/Python, all we’ll need is a way to make an HTML template. For this task, I’ll make a document in Microsoft Word, then export it as an HTML file. I’ve dabbled in front-end web development, but HTML is certainly not my strong suit, so I’m using the Word.doc->HTML route because it works for me. If you’re handy with another HTML document editor, feel free to use it, all that matters is that we end up with a .html file that can be rendered successfully in a web browser.
The Design Process
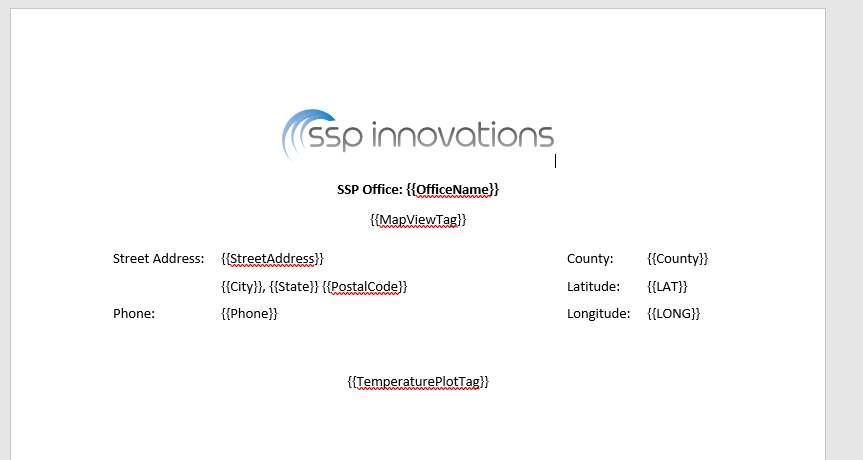
First, to begin the template, I opened Word and pasted in a copy of the SSP Innovations logo. I added some headings and some variables that jinja will replace with the values we provide from our data. If you’re familiar with python-format strings using the f“{variable_to_print}” syntax, this will look very similar. Jinja wants you to provide the variables in double curly brackets (eg. “{{my_variable}}”). I also added a section for the map view and the temperature plot. There are more elegant ways of embedding the variables directly into the HTML code for sourcing an image, but since making an <img> tag in HTML is pretty easy, and I’m using Word to generate the HTML, I took the easy way of just making a placeholder for the entire tag. Once finished, I ended up with a word doc that looked like this:

Then I exported the .doc as an .html file and, poof! I’ve got an HTML template. I had to update the HTML file to reference the full path of the logo file it exported, and I had to clean out a few to the variables that Word decided needed “<span>” between the variable name and the curly brackets, but other than that, I had a fully working template. If you’re using some other HTML editor hopefully you won’t have to deal with those little hiccups.
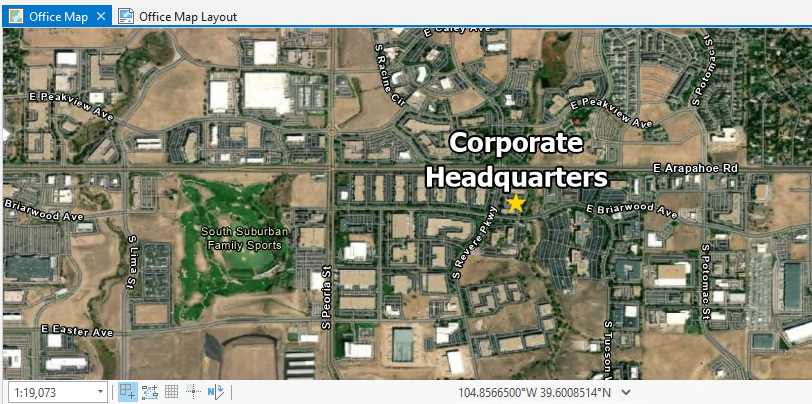
With the template creation out of the way, I went to ArcGIS Pro to set up my APRX file that will be used to make the map view that will show up in the template below the office name. I added a layer to my map sourced to the OFFICE feature class in my database, symbolized it as a star, and added a label to it for the office name. I set the basemap to use the hybrid imagery service from ESRI to give it some context. Finally, I inserted a new layout to my APRX, set the page size to be 6”x4” so it would display nicely in the feature report and saved the APRX.

Now that we have a template HTML file and the APRX that will be used for the map in the feature report, we can get to the fun part, the python that ties it all together. I’m not going to go line by line in this post (the code has lots of comments to help guide you), but the high-level objectives are the following:
- Load the APRX (so we can access the map view)
- Load the HTML template
- Pan the map to the point of the feature for the report we’re creating
- Export the map to a .png file
- Create a graph of the temperatures for the office and save it as a .png
- Render the HTML template with the feature’s values and map view/temperature plot img tags
- Convert the HTML to a PDF
|
Wisconsin.pdf |
I’ve got the code in this repo along with the data, word document, and the HTML template that was used to create the PDFs
Possible for Reports Ideas
Here are a few report ideas that jumped into my mind when writing this blog that might get your feature report ideas flowing
Gas:
- Completed leak survey reports showing all the mains and service inspected, perhaps with lots of map views, and any leaks that were identified because of the survey, easy to share with regulators to show compliance
- Cathodic protection test point reports showing the last X number of test point readings on a graph so the cathodic protection department can see if they need to take action
- Valve information report for quick and easy access to critical information about the location of the valves and number of turns to close, accessible thru the GIS and/or the asset management system
Electric:
- Substation report that shows the emergency contact information for a substation that can be printed off and hung in the substation in case of emergency
- Transformer report that shows transformer information in addition to the voltage readings of the meters connected to the transformer and plots them all on a graph for assessing the load on the transformer
- Transformer report that shows the oil readings over the past X number of inspections for maintenance situational awareness
- Vegetation management workorder report that shows the area for tree trimming activities
In Conclusion
I hope that this post has helped demystify the process of using your GIS data to create feature reports. Creating feature reports can be as easy or as difficult as the form dictates. If the form only requires information that is easily pulled from the GIS, then it’s going to be relatively simple to create a report. But if the data is stored in multiple tables and/or databases/web services then the way the data is engineered in the python script could be rather complex. If you have questions or comments on creating reports, please reach out! I enjoy this sort of stuff!


What do you think?