Overview: Esri Operations Dashboard, Widgets and Performance
Digging into widget development can be a lot of fun, especially because of how far you can take out-of-the-box functionally with very little knowledge and effort. Yet, before we build a better Esri operations dashboard mouse-trap, let’s run through a quick architecture overview of the Esri operations dashboard. This lets us see how we can use browser performance monitoring tools to gain more insight into how our tools are running.
If, after reading this, you feel like you have a few gaps, you may want to review the first part in the series and follow the Esri samples mentioned.
Overview – Architecture
If you not familiar with publishing content to the Esri Operations Dashboard, this post will help. First of all, you can push your data into the cloud or expose ArcGIS Server, which lets ArcGIS Online consume your enterprise data directly.
Today, were going to assume we want to get our enterprise data out using ArcGIS Server. Once our data is published, we want to build a new map using ArcGIS Online be sure to use the feature services we discussed in part on that will allow us to query our data directly. When we first log in to our Esri Operations Dashboard, we are prompted to enter our ArcGIS Online user name and password. After we have authenticated, we should see our new map. (If you have trouble with this part, please review post 1 and the Esri samples in that post.)

The Code
The search tool is a custom widget that is searching our exposed feature service, based on a “where” clause provided. A button click will retrieve the OIDs of the feature class from the server then send the OIDs back to the server, to select the features on the map. The map will then request an update and, finally, be sent the new selected features. As a result, all of our other widgets with a data source that matches our “where” clause and the new map based selection set will update a second out of the box bar graph widget.

Test Setup and Execute
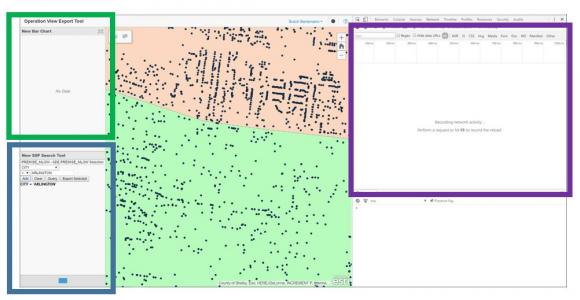
With the search tool configured and an out-of-the-box bar chart that will be driven off the selected data we are going to configure the ArcGIS server to return 100,000 records and review the calls, the duration of the calls and the size of the retuned payload. We will be querying the feature class where city = ARLINGTON. This should return us 9,479 records. We are going to launch our Esri Operations Dashboard in Chrome. Then, open the developer tools to see the requests. In the screenshot below, our out of the box widget can be seen within the green box the developer tool performance window in the purple box and the custom search tool in the blue box.
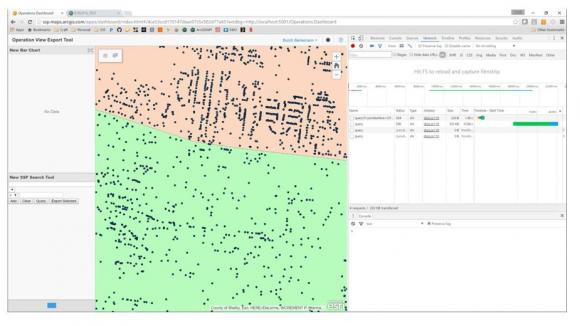
The first query is making the following call confirming that we are requested data based on the where clause we provided.
The second call is telling our Esri Operations Dashboard to select the features based on object id.
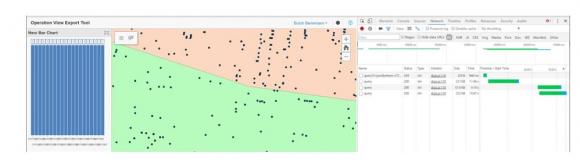
After the final two calls have completed (feeding the bar chart and search tool) we can see that the new bar chart is populated and the features on our map have been reduced.
Conclusion: Widgets and Your Esri Operations Dashboard Performance
With a little bit of knowledge and hard work, you will be amazed at how far you can extend the ArcGIS platform. Tools including the Chrome developer tools will allow you to build better Esri Operations Dashboard widgets. They will also help you monitor the performance of your widgets.


What do you think?