Most customers who implement Schneider Electric Designer™ end up including some level of custom reporting. The basic product includes some canned reports including an inventory report and a basic cost report, but they rarely capture the detail each utility requires.
We’ve implemented a number of different report types within Designer™ including plenty that are integrated to our Workforce Management system and/or other third-party work management systems. This article covers some of the most integrated approaches to custom Designer™ reporting.
When a client requests custom reporting, we first explore how the report will be used and the most effective format for the report. In many cases we have followed the standard report format by generating the reports in HTML. This allows the report to be opened in any common browser (Internet Explorer, Firefox, Chrome, etc.) and is very portable.
But occasionally a customer has more advanced requirements that are better suited for a comprehensive report within Microsoft Excel. When we hear of reports with advanced page layouts, complex formulas, or the need for multiple tabs, Excel is usually the recommended solution.
When implementing custom reports with Excel we can follow two differing implementation schemes. The first is very similar to the HTML reports, in that we simply format the report as an HTML-based output using various Excel-like styles to format the data (cell border, coloring, fonts, etc.). We then simply save the report with an “xls” extension.
When the report is subsequently opened in Excel, the software is smart enough to interpret the HTML and displays the resulting report nicely. This works great for single-tab reports with minimal print formatting.
The second implementation scheme uses full-blown Microsoft Excel programming to render the report. This is by far the richest option when it comes to formatting, formulas, and printing, but it may take just a bit longer to implement.
With this approach we usually take the design step of creating an Excel template for the report with all logos, headers, print formatting, and many (if not all) of the formulas. This works well because we can actually pass that template back to the customer for review and/or updates. To set the spreadsheet up, you can use just about any options available in Excel and this task is even easier if you have existing Excel reports that we can use as a starting point.
The added bonus here is that you can create multiple tabs within a single Excel spreadsheet template. That way instead of having to create multiple related but separate reports, you can just have a single report populated with the differing data on separate tabs.
In the below example implementation we did for Intermountain Rural Electric Association (IREA) we created a template with four tabs:
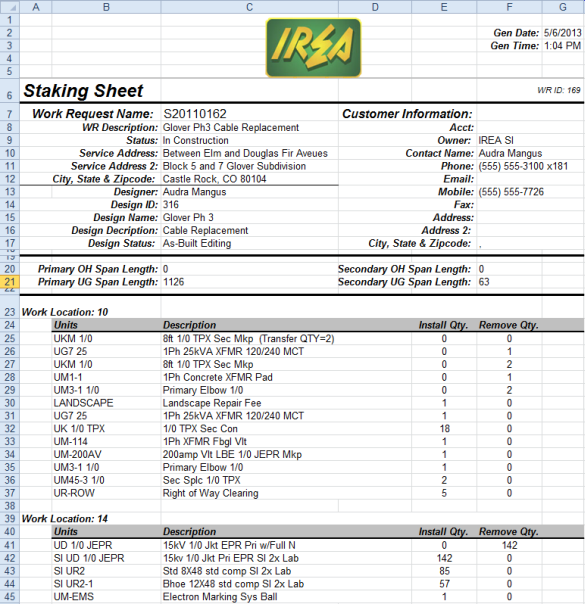
- Staking Sheet – this tab contains each Designer™ work location with the CU’s listed out and subtotaled by removals and installs. The removals are shown before the installs.
A crew can easily use this report in the field while performing work at each work location.
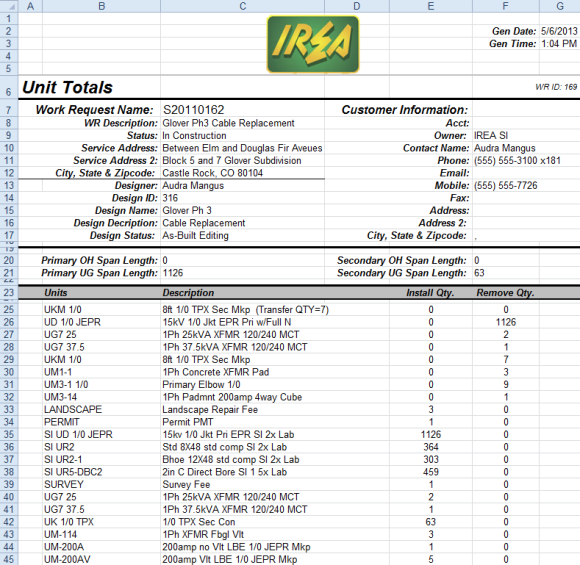
- Unit Totals – This tab totals ALL of the CU installs and removals for the entire work request. Once again removals are shown before the installs. This report can serve as a warehouse pick list and/or a job summary.
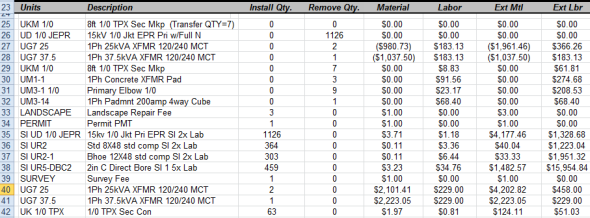
- Staking Sheet with Costs – This tab is identical to #1 above except that it includes the various costing for each CU – including material & labor unit cost along with the total material and labor cost for each CU by work location.
This is a great, detailed cost report. The costing totals are captured at the top and can even include any overhead amounts that need to be calculated and applied.
- Unit Totals with Costs – This tab is identical to #2 above except that it includes the various costing for each CU including material & labor unit cost along with the total material and labor cost for each CU by work location.
This is a great summary cost report for the entire job.
Each report contains common header data identifying the key fields of the work request that are maintained in either Designer™ or within an integrated work management system.
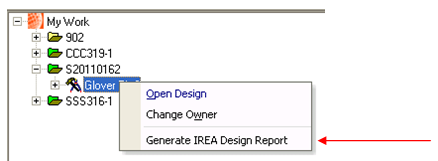
The beauty of this report is that is that it can be generated with a single click within Designer™ Workflow Manager. And because we aren’t using any ArcObjects, the report is available in standalone Process Manager (i.e. Workflow Manager disconnected from the GIS).
We exposed the report via a subtask that could be fired for a selected design in either the available tasks drop down:
Or via a right-click option directly on the design node:
Then the report is loaded with all four tabs fully populated. The coding behind the report extracts the data for the report and uses Microsoft Excel programming objects to load the pre-formed template and enter the data.The resulting report is saved to the user’s documents folder using a unique name based on the work request and design.
This powerful reporting solution pattern has worked well for IREA and several other SSP customers. While this example is specific to Designer™, it can also be implemented within any other product if the need arises. Hopefully this sparks some cool reporting ideas for you. If you have an idea to share we’d love to hear from you!


What do you think?