Maybe it’s a dumb ask, but shouldn’t there be a map that shows how bad mosquitoes are?
I can’t find one anywhere. Every map hits some specific data point like the range of a particular disease-carrying species of a mosquito or what month mosquitoes come out in wide, generalized swaths of the country.
“I just want to know how bad mosquitoes are
by looking at a map.”
And I want to know more specifically than a state because states are too big to generalize this information. Most normal people understand this question, don’t they? Will I constantly scratch my arms and legs in the summer? Will the smell of bug spray overwhelm the smell of barbeque? Will I spend any time on the deck this summer without lighting 27 tiki torches and half a dozen citronella candles?
I realize definitions matter. But no good definitions and maps created from those definitions that I would find useful seem to exist anywhere on the internet.
Now, I’ve lived in Illinois, Indiana, Wisconsin, Minnesota, Colorado, and North Carolina.
I can tell you, dear friends, there is a big difference in these places when it comes to enjoying the outdoors. Anyone who says DEET is bad and never lived in Wisconsin can go pound sand. You’d routinely read stories about small dogs getting carried away by swarms of mosquitoes in Minnesota. Colorado is so healthy simply because no one gets punished with itchy legs for taking a walk on a summer evening.
When I moved to North Carolina from Colorado to be close to family, I was dreading the mosquitoes. But I moved to the Appalachian Plateau. And at least in the place I live, mosquitoes aren’t really a problem.
This blew me away.
I never even thought about this as a possibility. I did some research and evidently, the water drains away fast enough from the high country here so there really isn’t a lot of standing water for those dang blood suckers to complete their lifecycle in. A little more research revealed four questions I need to answer to finally come up with, through the magical power of spatial analysis, a once-and-for-all useful mosquito map for the good old US of A. These data points will be calculated into watershed polygons which makes sense to me since so much of this is related to water.
1. How humid is it?
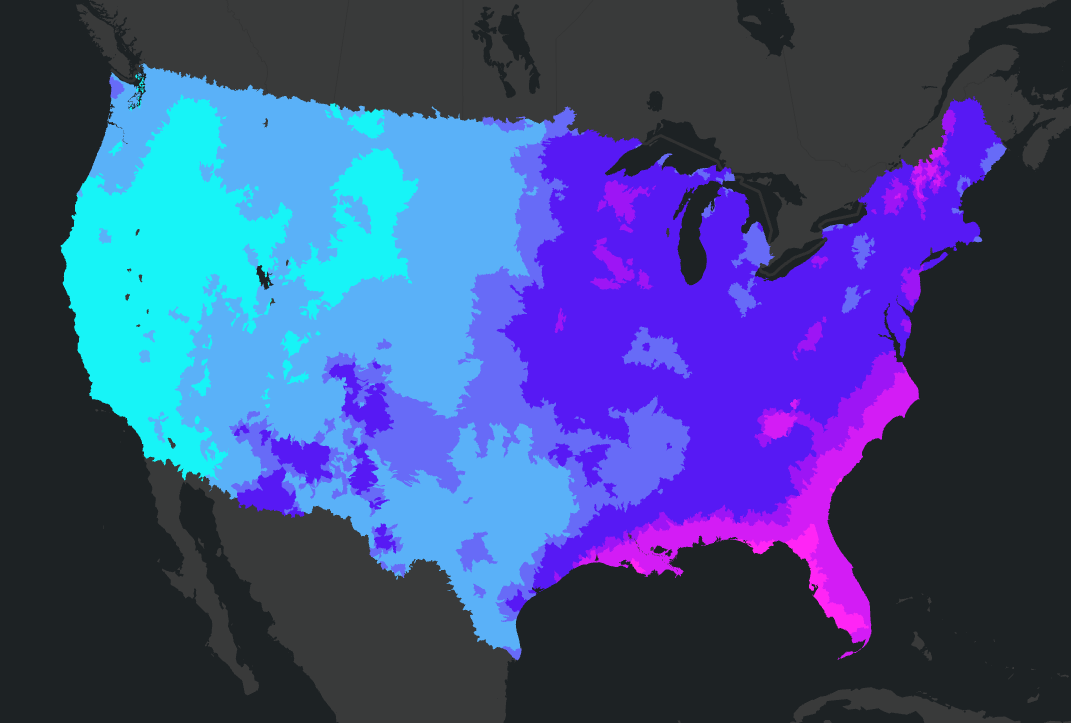
I’m going to use average daily dew point temperatures in August as a decent surrogate because humidity data is relative and as such hard to aggregate. I’ll calculate the average value into a small watershed polygon layer using a continuous raster. I found this data at worldclim.org. The assumption here is that higher humidity will score higher for mosquitoes (lower for humanity). No surprises here.

2. How much wetland is there?
This could be cobbled together in a few ways, but I think the easiest is just a percent wetland out of the total area of a watershed. I’ve found data from the National Wetlands Inventory (2021). Like a lot of infuriating government websites, it has no apparent way to download all the national data in one go like an FTP. So, I had to remedy this annoyance with a python script to scrape, unzip, filter, reclassify, polygonize, dissolve, and reproject 27 gigabytes of data. We will assume more wetlands, more mosquitoes. This was a bear of a task. I tested a few methods of processing with different scripts until I found a relatively efficient path forward (but it still took a full day of processing time).
Note: I removed coastal waters and lakes over 1,000 acres because these aren’t the right kind of habitat we are looking for.

3. How much does it rain?
The precipitation total for August will be used instead of an annual measure. Data collected during the winter months is not relevant to us. I will assume a simple linear relationship between rainfall and mosquitoes. I found this data at worldclim.org. I find a lot of people east of the Mississippi surprised by how dry the Pacific Northwest is in the summer.

4. How hot is it at night?
For temperature at night, I can just use the average daily minimum for August which will most likely be the nighttime low. We will assume the higher this nighttime temperature, the better for mosquitoes as per my research. I found this data at worldclim.org.

Since the data relationship to our phenomenon is positively correlated, we can just add the values up for each watershed area if the number of classes in each layer is the same and the values are numeric, which they are. The higher the number, the worse it is. I added a little weight to the watershed area because this gives a more precise estimate of mosquito badness so I want it to show up in the map.
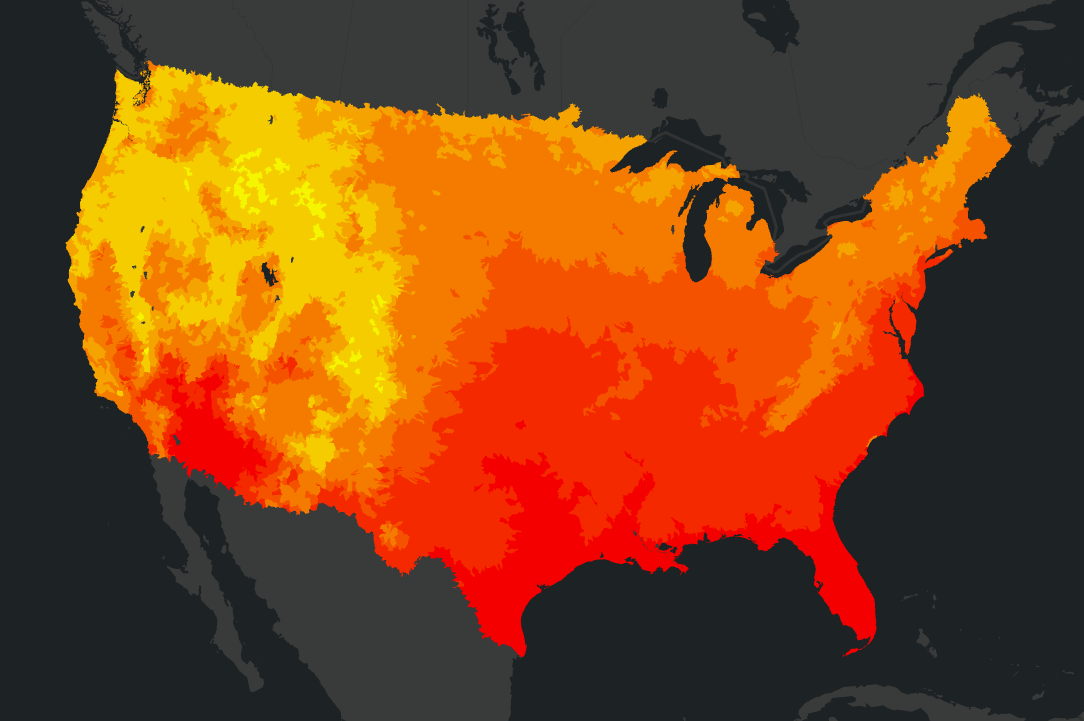
Behold in all its glory. Finally, a map of how bad mosquitoes are in the USA.

I checked this information against my own experiences as well as what people on internet forums say about places and it seems to be pretty accurate so far. The wetland data contained more than 35 million single part polygons and the watersheds numbered north of 15,000. I ran a dissolve on my output and got it to a manageable size. It’s now published to our SSP ArcGIS Online site and you can hit this map to explore the findings interactively.
I was surprised by the darker watersheds near Phoenix, AZ so I searched for some mosquito discussion at city-data.com. Sure enough, a thread was detailing the surprising amount of mosquitoes in Scottsdale and Tempe near Phoenix. These anecdotal observations by real people line up with the map. These very small, localized hot beds of mosquito activity get washed out by the generalization that occurs being close to large amounts of dry desert with very few areas supporting mosquitoes.
The data should be interpreted as a relative measure of mosquito’s annoyance during the warm months. Chime in if this matches your own experiences living in different places or if you have an idea of how to improve this with some other dataset or tuning. One thing I thought about but did not include is wind speed data. Some people seem to think windy places are better in regard to mosquitoes.
I came across some interesting history when doing research for this post. Evidently, mosquitoes were much worse in the past and the nation waged a sort of war against them with massive programs of wetland drainage, pesticides, and other vector control measures. And to a degree, many places in the South continue large-scale programs to control mosquitoes with foggers and bacteria treatments, etc.
At any rate, I resisted the urge to name this post “A Mosquito Map that Doesn’t Suck” so I feel proud of myself regardless of my map’s level of perfection.


Allison N. says:
I KNEW IT! I KNEW THE MOSQUITOS WERE WORSE IN QUINCY!
I work a job where i go outside often during the summer, and i visit various sites along the MISSISSIPPI river stretching from southern wisconsin to northern MISSOURI. From personal experience i always thought the mosquitos just seemed worse in the area near Quincy IL. The darker patch in that exact area on this map just confirmed that I’m not making it up. Thank you for putting so much thought and time into making this, it’s awesome.
PiETER says:
Hi Allison (can’t seem to get window to turn off all caps sorry!)
Been looking for THIS MAP !! LOL.
Been where you’ve been PNW AZ CO NC WI. Lines up.
Read up on Bull Shoals AR. They claim no skeeters there.
Reason being …. limestone area, so rock is porous and drainage excellent.
So bedrock conditions are another fine tuning layer.
FL in WINTER …. found skeeters almost everywhere I’ve been.
Gulf side, Melbourne, Orlando. I’m talking daylight hours not dawn/dusk.
But oddly, not the Treasure Coast. Dawn/dusk yes.
No clue why as standing water is everywhere.
CA Sierras at elevation, next to small lake (Hume). No skeeters.
Park ranger said bats. Loads of them.
So there’s another layer.
Thought about crowdsourcing a map by zip?
From 10 = thick to 0 = none?
Good job and enjoy NC …. I do summers there
Pieter
Zach alan says:
not sure I ever saw mosquitoes in San Diego? possibly just not in the neighborhood I was in
andrew says:
Really cool map. However, mosquitos are worse in tucson, AZ than the map would have you believe.