
A couple of months ago in my first post about quality, I wrote about Quality Assurance and Quality Control (QA/QC) and what each of these means to me.
Quality Control is about doing things in-process to produce quality results; it’s about doing whatever can be done to force quality into a process. Quality Assurance is a post-process activity which is undertaken to verify and measure the quality level of the output from a process. Quality Assurance gives you a score. QC = during, QA = after.
If you’re a GIS Manager for a utility or have responsibility for the quality of a utility’s GIS data in some way, how can you go about improving the quality, and therefore the value, of that data? Based on the definitions presented above, it seems like the place to start is QC, introducing enhancements to the data acquisition and maintenance processes to improve quality. This may make perfect sense, if you are confident that you know of specific areas in which to focus. But if not, then it probably makes sense to start at the back end, with the implementation of a Quality Assurance program which will provide a measure of your overall data maintenance quality and will also identify quality shortfalls, areas in which you should focus your quality improvement efforts.
SSP Wind Lake has completed a variety of Quality Assurance projects for our customers and we also perform internal QA on all our data maintenance and data enhancement work. As we have refined our QA practices over the years, we have arrived at a standardized set of procedures which efficiently identify process shortcomings along with specific errors, resulting in meaningful feedback to both our external customers and internal managers. We believe this same QA approach will bring benefit to your organization and will result in improvements to the quality of your GIS data.
SSP’s GIS data Quality Assurance programs have three common areas of focus, which are:
- Automated data testing routines
- General visual and table scans
- Statistical data inspection based on random sampling
Automated Testing
Automated data tests are typically a series of software routines which can be run individually or in sets to inspect the GIS data work. Automated data tests may include, but by no means are limited, to the following:
- Presence of all required attribution and unit records
- Attribute cross checks, such as transformer phase vs. conductor phase
- Presence of related, required annotation
- Snapping/connectivity checks
- Various attribute traces, such as pressure and CP system for gas or phase and circuit ID for electric
Automated tests can actually blur the line between Quality Control and Quality Assurance, depending upon when they are utilized. The closer the tests are to the completion of the GIS mapping work, the timelier the feedback to the mapper. A set of comprehensive tests can also be run periodically against larger data sets to provide an overall sense of data quality.
Ideally, the tests will output a report of the errors discovered and will also flag each of the errors in the GIS. This will provide meaningful feedback regarding specific errors. The tests should also summarize the number of features and attributes checked and the total number of errors discovered, by type, so you develop a series of quality scores which can be tracked over time.
Automated testing is typically the most thorough and most cost-effective way to validate quality, so if it can be verified programmatically and you have the means, you should build the tools.
General Visual and Table Scans
This activity consists of a general visual and table review of a dataset to look for noticeable problems caused by the maintenance or addition of data. This review is conducted to gain a general understanding of the quality of the dataset and, if issues are identified, to generate as much meaningful feedback for staff as possible. This step in the QA process does not result in a quality score, but rather is designed to identify problem areas or trends within the data.
Since the visual review is intended to identify any obvious errors, as part of this examination there should be a focus on areas or situations that have been most troublesome in the past. Additionally, QA staff should review the attribute tables in each dataset (with the features sorted in various ways based on individual attributes) to identify any irregularities that may be evident through this type of check. Features in question based on the table review may need to be investigated further to determine if actual errors are present.
Unlike the random sampling step, where there should be no bias introduced by the individual(s) completing the verification, the main purpose of this review is for the QA staff to do their best to find errors, based on everything they know about the data and maintenance/update processes.
Statistical Data Inspection based on Random Sampling
This activity consists of a detailed review of samples of work. For new processes or new staff, it may be necessary to inspect all the work initially, since the error rate is probably above the acceptable level in these cases and there will likely be errors throughout the work which should be identified and corrected. In general, though, once an individual or process has “settled in”, inspecting a randomly generated sample of work versus all the work is much more cost effective when it comes to tracking quality and providing feedback.
Sampling
Internally at SSP Wind Lake, unless a customer has specified 100% inspection, we’ll QA 100% of a new person’s work, then gradually drop the percentage (50%, then 20%, finally 10%) as the individual proves that he or she can consistently produce work at a quality level equal to or above the project standard. Even at reduced inspection levels, error types are tracked and quantified and specific quality feedback is provided to each staff member. If an individual’s quality score falls below acceptable levels (usually 98 or 99%) then the percentage of their work subject to QA is increased, sometimes up to 100%, until they once again consistently prove they can beat the quality target. I think this is an effective approach, and recommend you consider something like this if you have responsibility for the quality of GIS data produced by a group.
When generating samples to be inspected, it’s very important that these samples be completely random. If they aren’t and the work to be inspected is “cherry picked”, it’s likely that the results will not be representative. For the most accurate scores over time, the human factor should be removed from sample selection. For our work order-based projects, we’ve developed a tool which randomly selects the work orders to be QA’d based on a specified percentage. For projects which involve data manipulation over a geographic area, we have a different tool which randomly selects sample polygons and tallies the number of features, by type, within the polygons (see figure 1 below). If you don’t have these kinds of tools, you can still be random by using a grid and rolling dice to pick squares or going down a list and selecting every 5th work order, as examples.
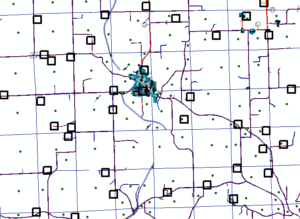
Figure 1 – System generated random QA polygons
Scoring
For quality scoring purposes, point values are typically assigned to individual feature types, depending upon the level of effort required to add or update those features within the GIS. On one of our projects, as an example, a gas excess flow valve is worth 11 points, based on the number of attributes to be added and the graphic placement requirements. Total points are then accumulated based on all the features placed or updated and error points are tracked for all individual graphic and attribute errors. We’ve built tools to track and manage this for us (see figure 2), but if this seems too complicated, you can simply say one point per feature. If anything is wrong with that feature, however (missing size, let’s say) then the full point is lost due to that error. This is OK, it just tends to reduce overall quality scores.
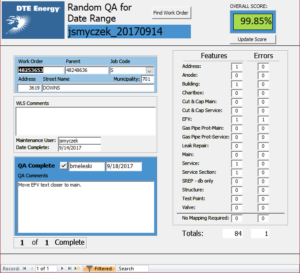
Figure 2 – Database Form for QA Scoring and Tracking for Work Order Posting Project
In Conclusion…
So what’s the bottom line when it comes to Quality Assurance? In my mind its two things – measure and communicate. Even if your methods are simple, come up with a way to score your quality, it’s the only way to know for sure if quality is improving. Just as importantly, make sure that the errors you are finding in your QA process are being shared as feedback with the staff producing the work. People want to know what they need to do to improve.
Based on our experience, we’ve shared some information here that has proven helpful when it comes to implementing a QA program for GIS data. There can be much more detail that goes into a robust QA program, certainly more than can be included in this post. But the important thing is to start, then expand and improve from there. If you would like some more advice regarding your QA program, specific help with tools or processes, or even resource support for your QA efforts, please get in touch, we’d love to talk!

What do you think?